과제를 하다가 그래프를 여러 개 그릴 일이 있었는데
이런 것에 적절한 add-on이 있을 것 같아서 찾아보았다.
쓰기 편리하고 괜찮은 add-on이 있어서 사용법을 기록해놓는 글.
1. Maximally Distinct Color Generator 애드온을 다운받는다.
다른 사람이 무료로 공개해놓은 애드온이기 때문에 그냥 다운 받을 수 있다.

여기 add-ons에 들어가서 검색한 다음에 install하면 된다.

2. 사용법
기본적으로 예제를 넣어놓으셔서 별 어려움 없이 쓸 수 있다.
아래가 만든 분이 써놓은 예시이다. (이 예시만 봐도 바로 응용해서 쓸 만하다.)
>> N = 5;
>> fun = @sRGB_to_OKLab;
>> rgb = maxdistcolor(N,fun)
rgb =
         0         0    0.8095
    1.0000    0.3858         0
    0.8254         0    1.0000
    0.4286         0    0.0159
         0    0.8189         0
>> axes('ColorOrder',rgb, 'NextPlot','replacechildren')
>> X = linspace(0,pi*3,1000);
>> Y = bsxfun(@(x,n)n*sin(x+2*n*pi/N), X(:), 1:N);
>> plot(X,Y, 'linewidth',4)

>> maxdistcolor(5,fun, 'exc',[0,0,0]) % Exclude black (e.g. background).
ans =
    1.0000    1.0000    1.0000
         0         0    1.0000
         0    0.6772         0
    1.0000    0.1969    1.0000
    0.5238         0    0.0635

>> maxdistcolor(5,fun, 'inc',[1,0,1]) % Include magenta.
ans =
    1.0000         0    1.0000        % <- magenta!
         0    0.8583         0
    0.1111         0    1.0000
         0    0.2677         0
    0.8254    0.3858         0

>> [rgb,Lab] = maxdistcolor(6,@sRGB_to_CIELab, 'Lmin',0.5, 'Lmax',0.7)
rgb =
    0.7619         0    1.0000
    1.0000         0         0
         0    0.7795         0
         0    0.5591    1.0000
    0.8254    0.6457    0.0794
    0.8254    0.2835    0.5397
Lab =
   50.3665   89.7885  -77.4167
   53.2329   80.1093   67.2201
   69.9972  -71.4464   68.9566
   58.7262    9.8285  -64.4614
   69.8987    5.1700   70.3789
   52.1378   59.8754   -6.6658
애드온에서 살펴보면 이 애드온이 가지고 있는 함수들은 다음과 같다.

여기 중에 test로 시작하는 코드와 maxdistcolor 코드를 제외하고
CIELab_to_DIN99
CIELab_to_DIN99o
sRGB_to_CIELab
sRGB_to_OKLab
sRGB_to_OSAUCS
다음 함수가 있다.
다음 코드가 있는데 내용을 이해하고자 하면 아래 코드를 보자.
rgb = maxdistcolor(N,fun)
위 코드에 들어가는 fun은 다음을 의미한다.
(maxdistcolor의 주석을 가져온 것)
% fun = FunctionHandle, a function to convert from RGB to a uniform colorspace.
% The function must accept an Nx3 RGB matrix with values 0<=RGB<=1, and
% return an Nx3 matrix in a uniform colorspace (UCS), where the columns
% represent some version of [lightness,a,b], e.g. [L*,a*,b*] or [J',a',b'].
간단하게 말하면 RGB를 uniform colorspace도 변환해주는 코드여서
위의 sRGB_to_CIELab, sRGB_to_OKLab, sRGB_to_ODAUCS
중 하나를 사용하면 된다. 이 세 개가 RGB를 다른 colorspace로 mapping하는 코드이기 때문이다.
(이 위키는 여기서 사용하는 color space에 대한 설명이다. 굳이 몰라도 상관은 없다.)
https://en.wikipedia.org/wiki/CIELAB_color_space
CIELAB color space - Wikipedia
From Wikipedia, the free encyclopedia Jump to navigation Jump to search Standard color space with color-opponent values CIELAB color space top view CIELAB color space front view The CIE 1976 (L*, a*, b*) color space (CIELAB), showing only colors that fit w
en.wikipedia.org
위에서
fun = @sRGB_to_OKLab;저장해놓고 maxdistcolor 함수에 넣으면 된다.
N = 9 ;
rgb = maxdistcolor(N,fun) ;
숫자 N은 뽑아낼 color 숫자이고 fun은 지정한 함수이다.
이렇게 output을 하나만 지정하면 rgb 변수에는 RGB 컬러 matrix가 저장된다.
RGB 컬러가 뭔지 모른다면 다음 글을 참고하는 게 좋을 것이다.
https://normal-engineer.tistory.com/242
[기타] 색상 RGB, HEX 코드 알아내는 방법
종종 색상코드를 알아야 할 때가 있어서 각종 색상코드를 알아내는 방법에 대해 찾았고 그 방법을 기록하는 글이다. 1. 원하는 색상이 무엇인지 찾고 싶을 때 여러 개의 색상 견본을 보고 고르고
normal-engineer.tistory.com
[~,ucs] = maxdistcolor(N,fun)다음처럼 output을 2개 받으면 두 번째 output은 주어진 perceptually uniform colorspace에서의 컬러 matrix를 주는데 이 matrix는 내가 지정한 fun(function handle)에서 conversion을 거쳐서 RGB로 return하는 것 같다.
세번째 output을 받으면 greedy algorithm 구조에 대한 파라미터들을 return한다. (다들 별로 관심은 없을 듯)
아래 결과를 보면 이해가 될 것이다.
[~,~,status] = maxdistcolor(N,fnh)

status =
  struct with fields:

          seconds: 0.827
          options: [1×1 struct]
        gamutSize: 524288
       iterations: 95
    minDistOutput: 0.28953
    minDistAndExc: 0.28753
    minDistNotInc: 0.28953
       colorspace: 'OKLab'
       axesLabels: {'L'  'a'  'b'}
3. 추가적인 기능
3-1. 특정 컬러를 포함하고 싶을 때
옵션 'inc'를 사용한다.
rgb = maxdistcolor(N,fnh, 'inc',[1,0,0;1,1,0]) % Include red and yellow.
axes('ColorOrder',rgb, 'NextPlot','replacechildren','XTick',[],'YTick',[])
plot(X,Y, 'linewidth',5)
3-2. 특정 컬러를 배제하고 싶을 때
옵션 ' exc'를 사용한다.
rgb = maxdistcolor(N,fnh, 'exc',[0,0,0]) % Exclude black (e.g. background).
axes('ColorOrder',rgb, 'NextPlot','replacechildren', 'XTick',[],'YTick',[], 'Color',[0,0,0])
plot(X,Y, 'linewidth',5)
set(gcf,'InvertHardcopy','off', 'Color','white')
3-3. lightness(명도) 제한
'Lmin'과 'Lmax'를 사용한다.
[rgb,ucs,sts] = maxdistcolor(N,fnh, 'Lmin',0.4, 'Lmax',0.6);
scatter3(ucs(:,3),ucs(:,2),ucs(:,1), 256, rgb, 'filled')
3-4. Chroma(채도) 제한
[rgb,ucs,sts] = maxdistcolor(N,fnh, 'Cmin',0.5, 'Cmax',0.6);
scatter3(ucs(:,3),ucs(:,2),ucs(:,1), 256, rgb, 'filled')
그 외에도 기능이 많아서 궁금한 사람은 maxdistcolor 함수 내부를 확인해보길 바란다.
4. 컬러 적용하기
위의 예시 코드에서는
axes('ColorOrder',rgb, 'NextPlot','replacechildren')라는 코드를 넣어서 사용하고 있는데 굳이 이럴 필요 없이
rgb = maxdistcolor(N,fun) ;
plot(x,y) ;
colororder(rgb) ;
이렇게 colororder라는 함수를 직접적으로 쓰면 된다.
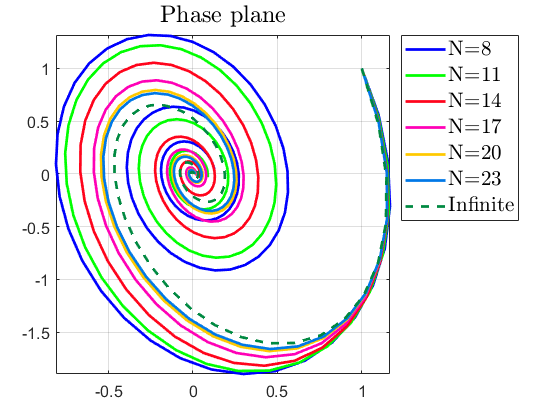
적용 예시
색을 일일이 찾아서 지정하기 귀찮았는데 덕분에 일을 덜었다.
'프로그래밍 Programming > 매트랩 MATLAB' 카테고리의 다른 글
| [MATLAB] 코드 진행 중 잠깐 멈췄다가 아무 키나 누르면 다시 진행 (0) | 2022.11.07 |
|---|---|
| [MATLAB] plot 함수에서 투명도(transparency) 조절하기 (0) | 2022.11.05 |
| [MATLAB] plot 그릴 때 마커 간격 설정하기 (230309 수정) (0) | 2022.10.09 |
| [MATLAB] classic plot의 color 순서로 설정하기 (0) | 2022.09.26 |
| [MATLAB] 시작할 때 자동 실행되는 코드 (startup.m) (0) | 2022.09.05 |